
Crypto Blog
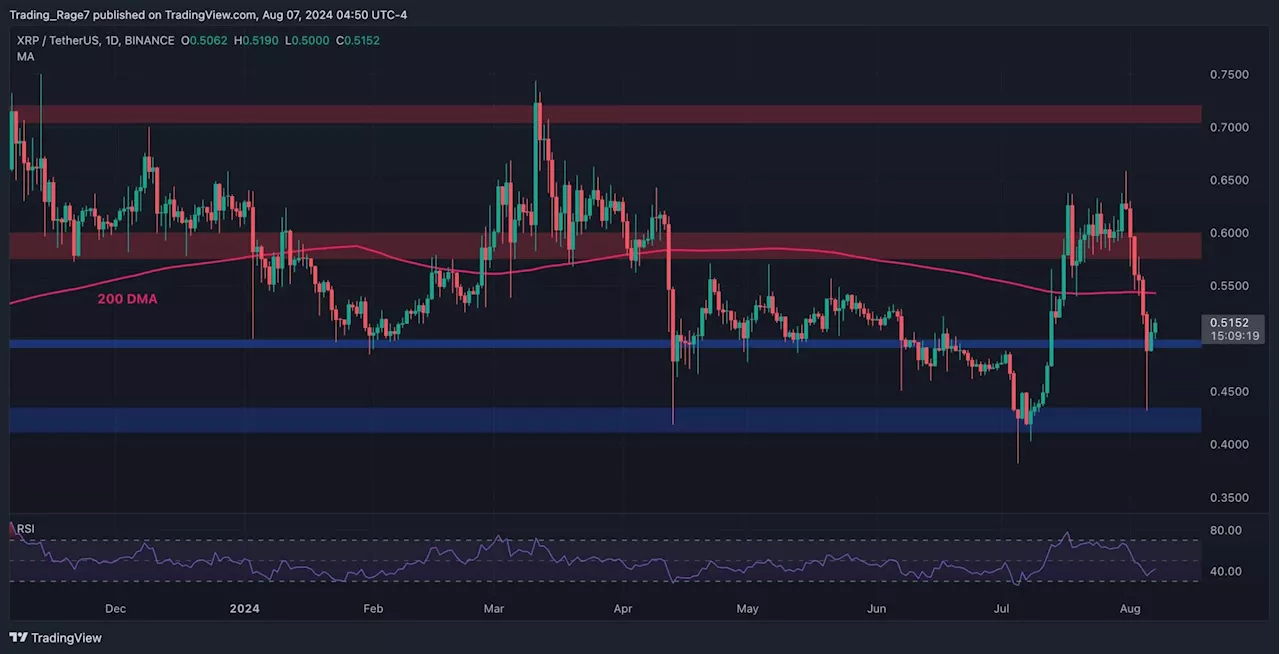
Ripple has recently surged to the critical resistance level of $0.65 following a successful pullback to the broken 200-day moving average.
A detailed examination of the daily chart reveals that Ripple has experienced a bullish surge after successfully pulling back to the broken 200-day moving average at $0.55. This price action underscores buyers’ dominance in the market, propelling the XRP price to a critical resistance region around $0.63—a level that has previously rejected the cryptocurrency multiple times.
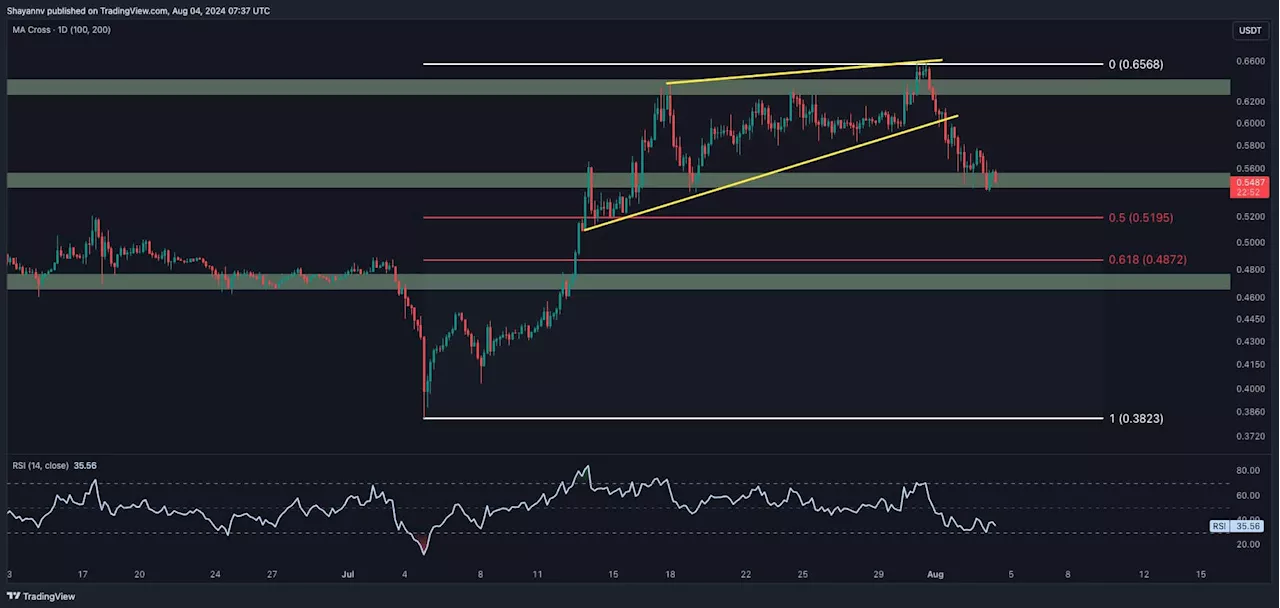
Given the bearish divergence between the price and the RSI indicator, a rejection at the $0.63 level is anticipated, potentially leading to a decline toward the lower boundary of the range at $0.55.On the 4-hour chart, XRP surged from the critical region between the 0.5 and 0.618 Fibonacci retracement levels, entering a crucial price range defined by the $0.55 support and the multi-month resistance zone at $0.63.
United States Latest News, United States Headlines
Similar News:You can also read news stories similar to this one that we have collected from other news sources.
 Ripple Price Analysis: Here’s Why XRP is Plunging Toward $0.5 and What to Expect NextCrypto Blog
Read more »
 Ripple Price Analysis: The Reason XRP Crashed by 6% in the Past 24 HoursCrypto Blog
Read more »
 Ripple Price Analysis: XRP Bulls Reclaim $0.5 Following the Devastating 20% CrashCrypto Blog
Read more »
 Ripple Price Analysis: Here’s What You Need to Know About XRP’s Next MoveCrypto Blog
Read more »
 Ripple Price Analysis: Is XRP on the Verge of Exploding to $0.68?Crypto Blog
Read more »
 Ripple Price Analysis: XRP Bulls Want to Aim $0.64 But There’s a CatchCrypto Blog
Read more »