
Crypto Blog
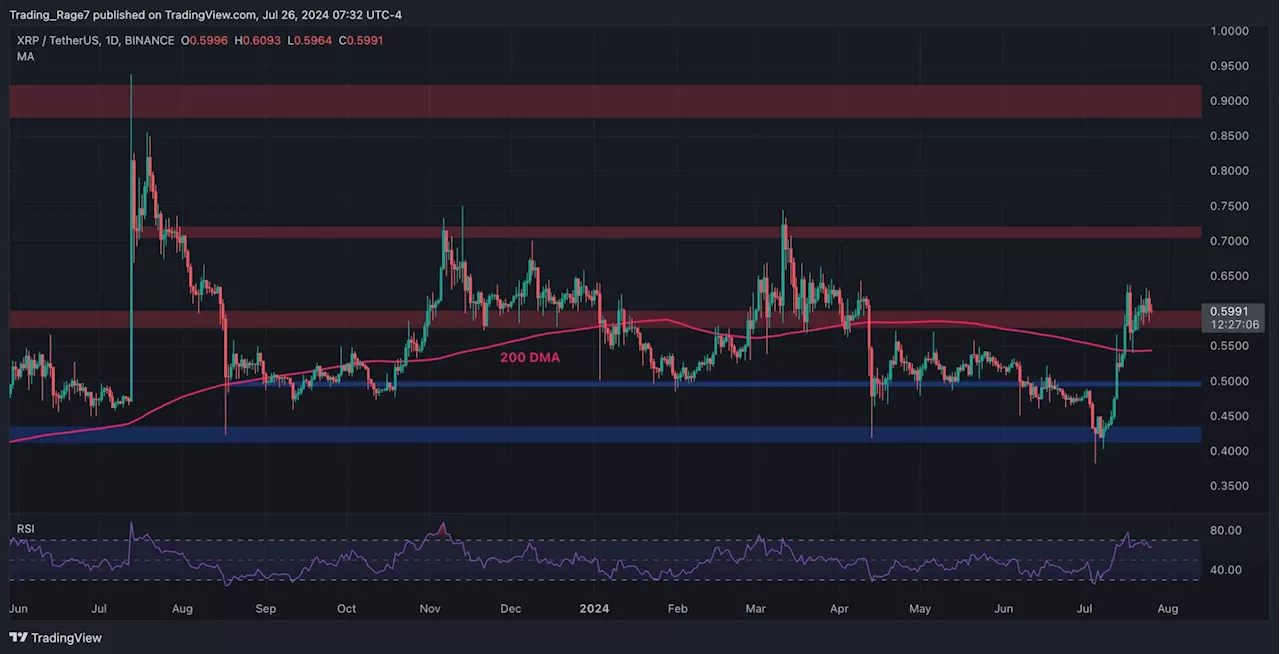
Ripple has encountered significant selling pressure near the $0.64 resistance level, leading to a sharp decline toward a critical support area around the 200-day moving average at $0.54.
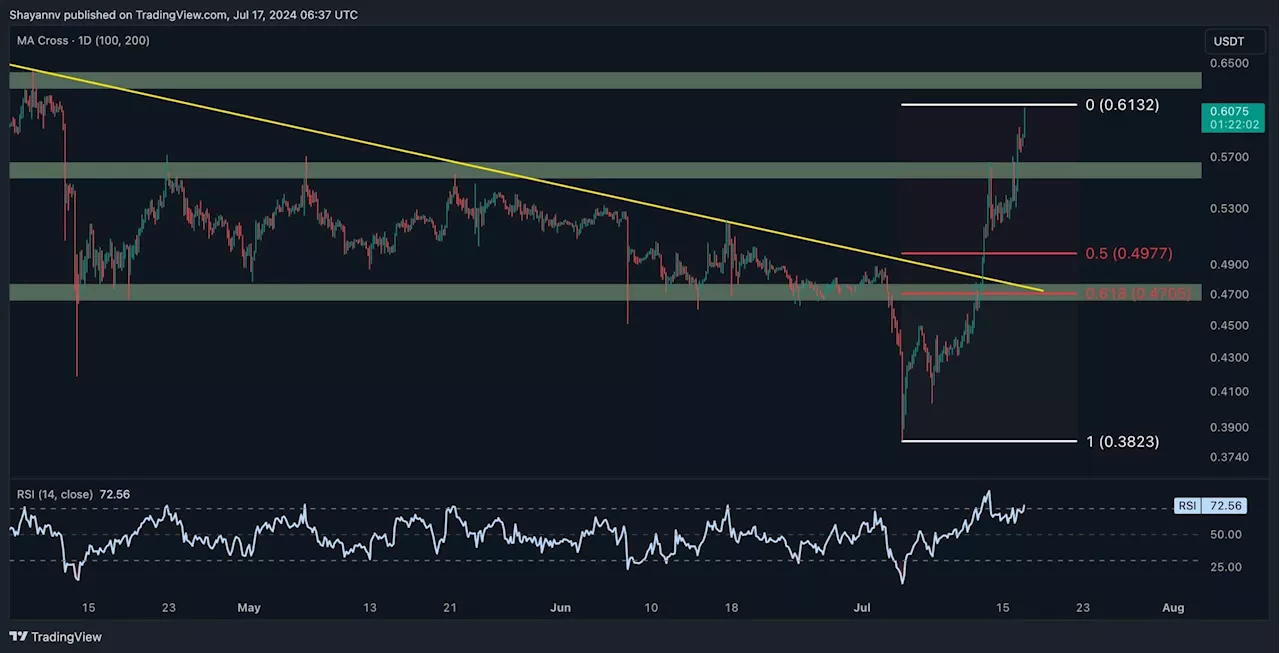
An in-depth examination of Ripple’s daily chart reveals that the recent bullish surge encountered significant resistance at the crucial $0.64 threshold, which led to a period of sideways consolidation. During this phase, a notable bearish divergence appeared between the price and the RSI indicator. It was followed by a substantial 17% decline, bringing the price down to a critical support zone.
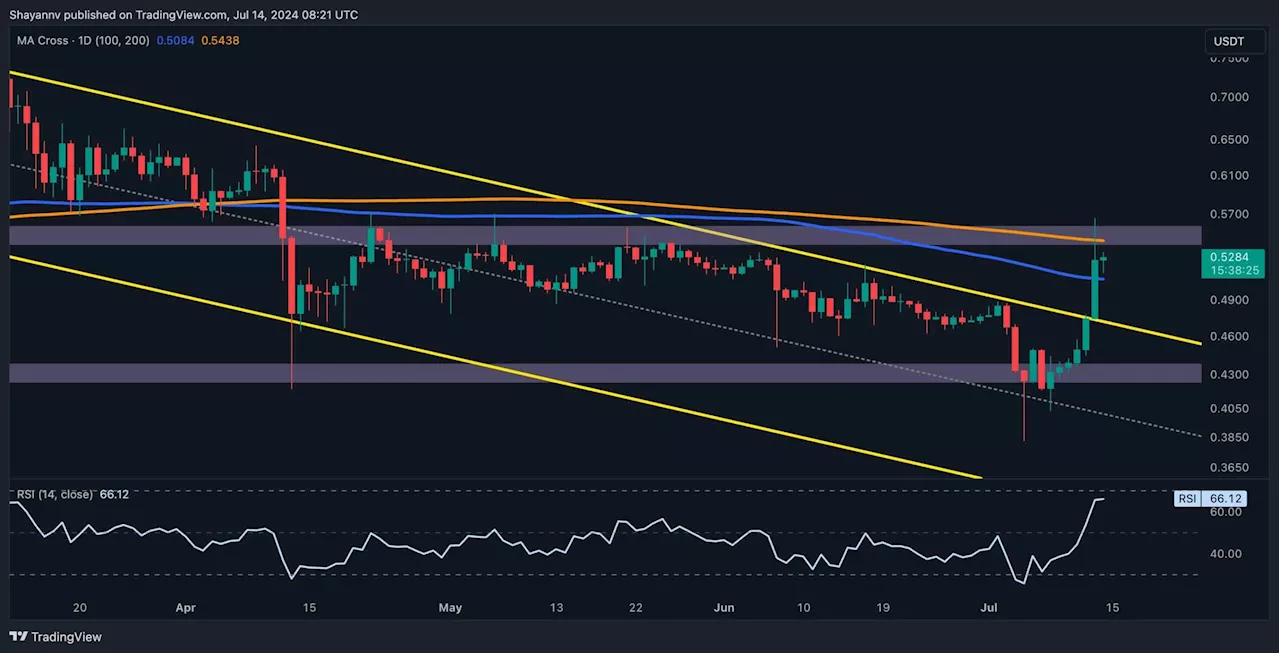
On the other hand, if the price breaks below the 200-day MA with strong selling momentum, it would signal a potential shift toward a bearish trend. This could put Ripple at risk of further declines, with the next major support likely around the 100-day MA at $0.51 or even lower. At the time of this writing, the price is attempting to trend lower.On the 4-hour chart, after facing increased selling pressure near the critical $0.
United States Latest News, United States Headlines
Similar News:You can also read news stories similar to this one that we have collected from other news sources.
 Ripple Price Analysis: After the Plunge Toward $0.4, What’s Next for XRP?Crypto Blog
Read more »
 Ripple Price Analysis: XRP Surges to $0.45 but Are the Bears Done?Crypto Blog
Read more »
 Ripple Price Analysis: XRP Explodes 20% Weekly, Here Are the Next TargetsCrypto Blog
Read more »
 Ripple Price Analysis: XRP Explodes Above $0.6 But Will the Bulls Hold?Crypto Blog
Read more »
 Ripple Price Analysis: XRP Bulls Keen on Taking Out $0.64 But There’s a CatchCrypto Blog
Read more »
 Ripple Price Analysis: Is XRP Ready to Finally Explode Above $0.60?Crypto Blog
Read more »