
Crypto Blog
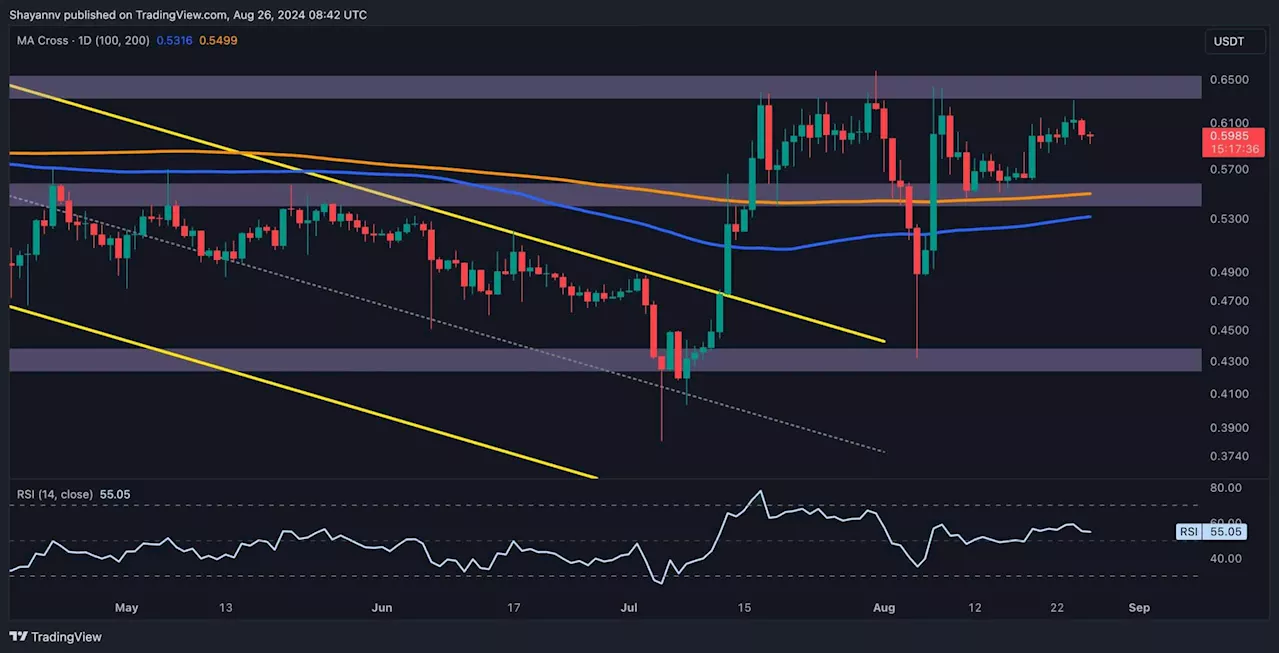
Ripple has found strong support within a critical price range, defined by the 100-day and 200-day moving averages, experiencing a significant bullish rebound.
An in-depth analysis of Ripple’s daily chart reveals that it encountered substantial buying pressure at a key support zone between the 100-day and 200-day moving averages. This surge in demand triggered a notable price recovery from the $0.53-$0.55 range, pushing XRP higher. The price is now trending toward the critical resistance level of $0.64, a zone that has repeatedly challenged Ripple’s buyers in recent months.
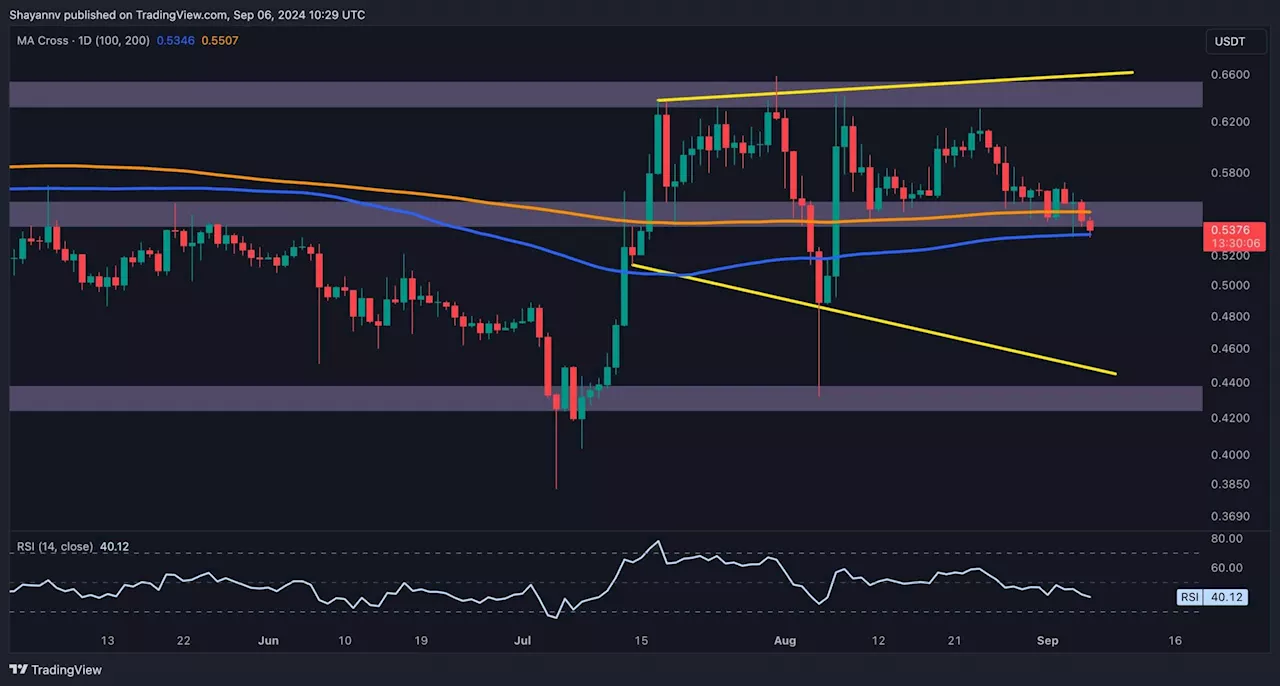
Ripple is now climbing toward the upper boundary of the flag at $0.62, a key level in this pattern. The descending flag pattern is a well-known bullish continuation movement if it is breached from its upper boundary.
United States Latest News, United States Headlines
Similar News:You can also read news stories similar to this one that we have collected from other news sources.
 Ripple Price Analysis: Is XRP on the Verge of an Imminent Correction Below $0.55?Crypto Blog
Read more »
 Ripple Price Analysis: Will The $0.55 Support Level Hold After XRP Was Rejected at $0.6?Crypto Blog
Read more »
 XRP Is Down 8% Weekly But Bullish Signs Appear (Ripple Price Analysis)Crypto Blog
Read more »
 Ripple Price Analysis: Bullish Sentiment Reaffirmed, Can XRP Climb to $0.64?Crypto Blog
Read more »
 More Pain for XRP Likely as Sellers Target $0.5: Ripple Price AnalysisCrypto Blog
Read more »
 Ripple Price Analysis: XRP Needs to Stay Above This Key Level to Avoid Further DeclinesCrypto Blog
Read more »