Crypto Blog
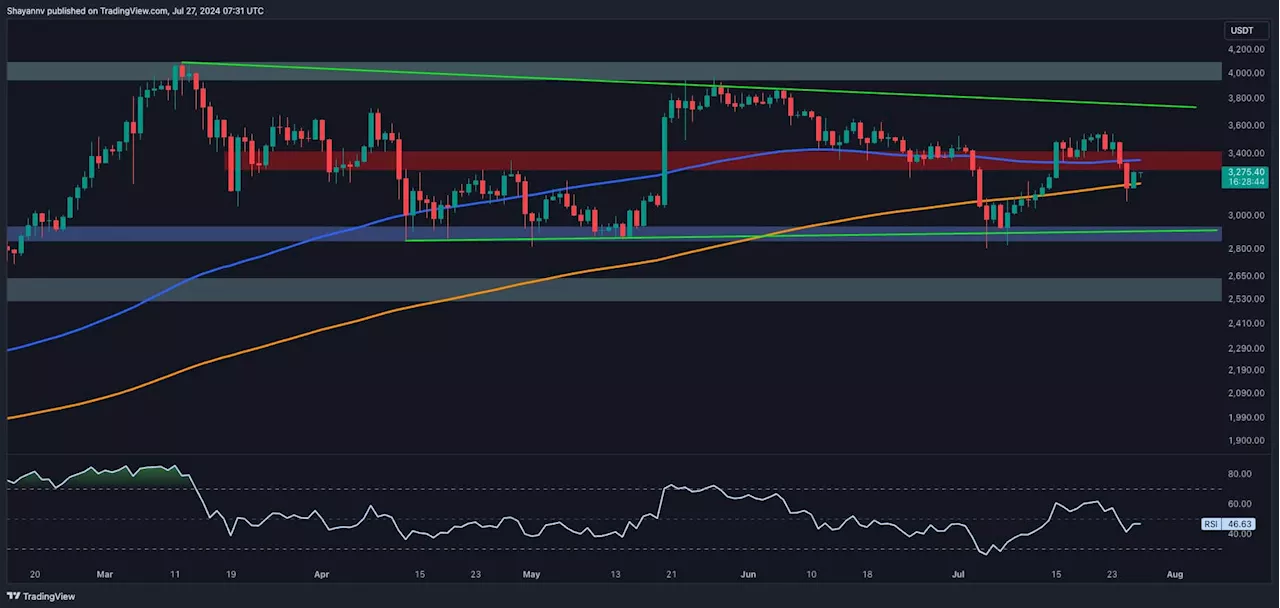
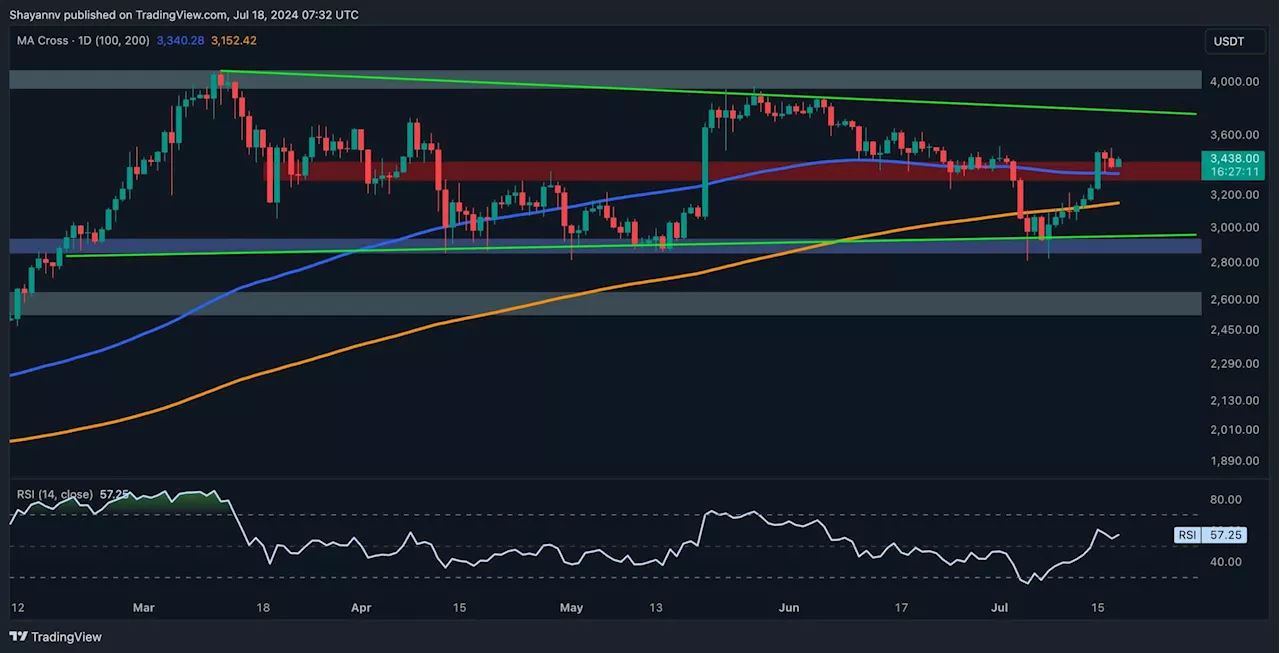
Ethereum has recently faced a notable rejection and experienced a 13.3% decline after breaking above the 100-day moving average.
A close examination of Ethereum’s daily chart reveals that after breaking out above the critical 100-day moving average at $3,354 and a brief period of consolidation, it experienced a significant rejection, resulting in a 13.3% drop.Despite this, Ethereum has landed on a significant support region centered around the 200-day moving average at $3.2K.
However, the overall price action indicates the presence of sellers in the market, with the price oscillating between the dynamic support of the descending trendline and the critical resistance region at $3.3K.
United States Latest News, United States Headlines
Similar News:You can also read news stories similar to this one that we have collected from other news sources.
 Ethereum Price Analysis: ETH Bulls Eye $3,500 as Hopes for a Bottom EscalateCrypto Blog
Read more »
 Ethereum Price Analysis: ETH Holds at $3K but is Another Crash Imminent?Crypto Blog
Read more »
 Ethereum Price Analysis: Is ETH on the Verge of a Deeper Correction Toward $2.7K?Crypto Blog
Read more »
 Ethereum Price Analysis: ETH Eyes $3.5K as ETF Launch Anticipation GrowsCrypto Blog
Read more »
 Ethereum Price Analysis: Is $3.7K Realistic for ETH or is a Correction to $3K Coming?Crypto Blog
Read more »
 Ethereum Price Analysis: Bullish Breakout Toward $4K More Likely for ETHCrypto Blog
Read more »