
Crypto Blog
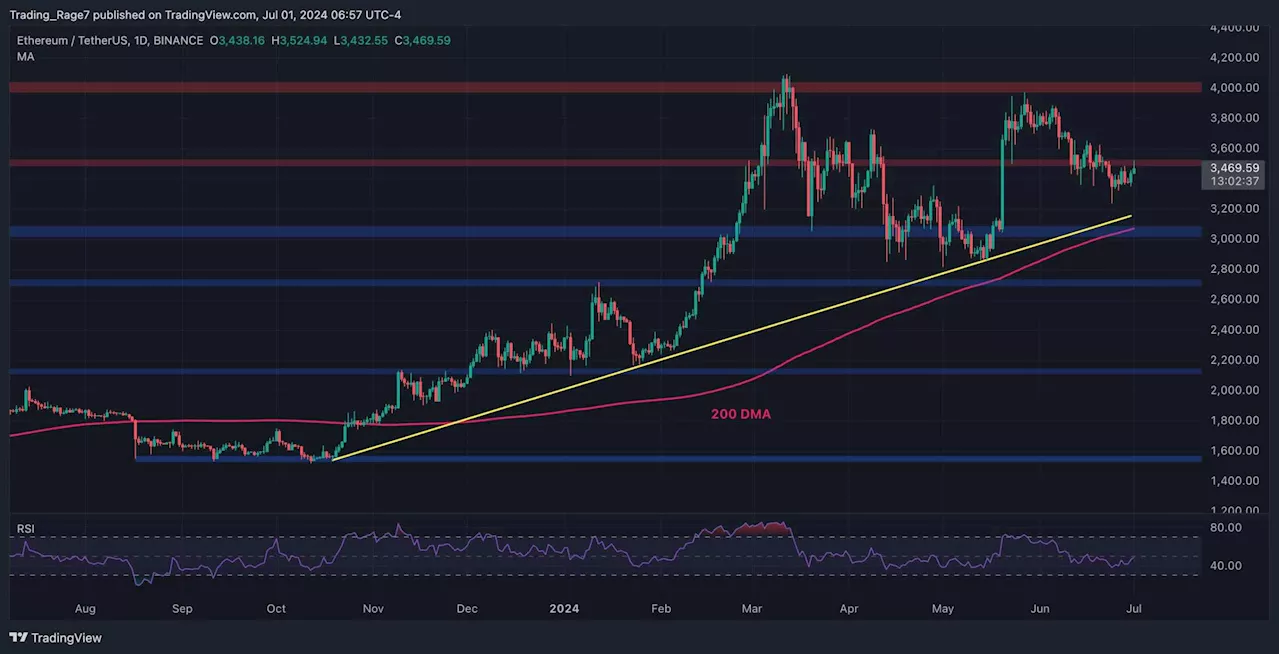
Ethereum has recently seen an uptick in demand near a crucial support level, leading to a notable rebound above the 200-day moving average at $3,134 and reaching the 100-day MA.
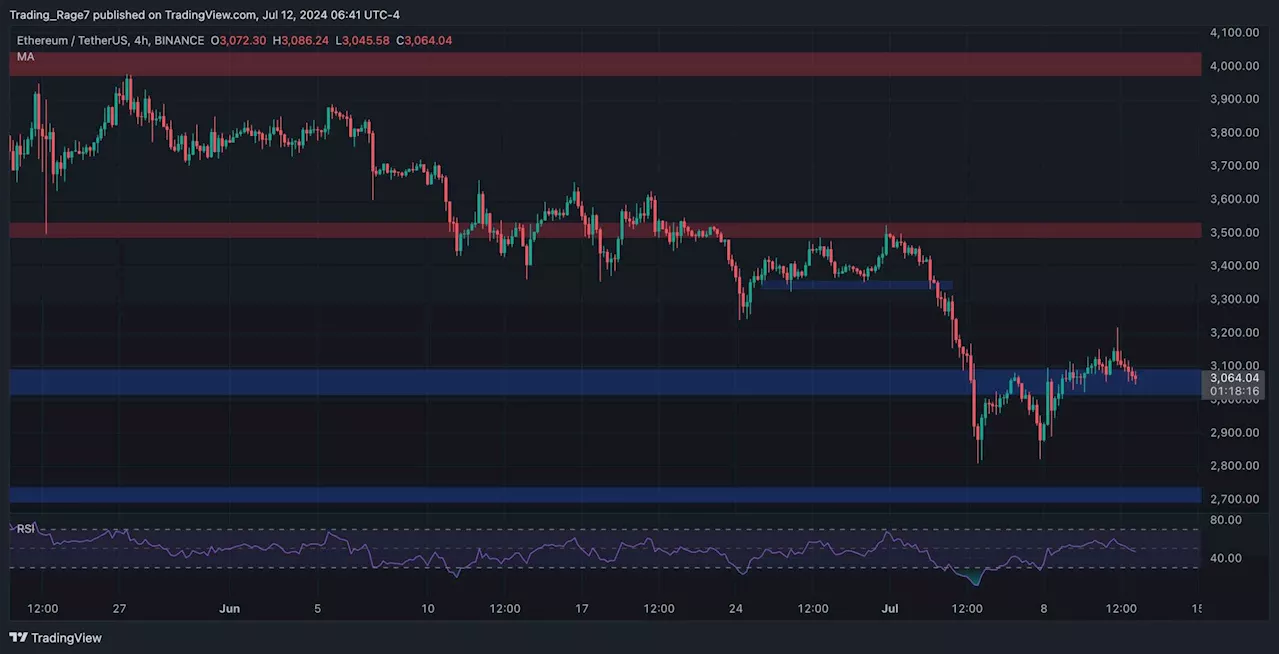
A detailed analysis of Ethereum’s daily chart reveals that after a prolonged bearish trend, the cryptocurrency briefly broke below the 200-day moving average at $3,081, introducing significant fear and uncertainty into the market, as this MA is a vital support level for the price. Currently, ETH has reached the 100-day MA of $3,142 and is on the verge of reclaiming it. This MA also aligns with the tactical resistance region of $3.3K, making it a robust barrier to buyers. Yet, if it stabilizes above the 100-day MA, this could confirm a bullish revival in the mid-term, with the next target being the $4K yearly high.On the 4-hour chart, Ethereum faced rejection near the multi-month descending trendline at $3.5K, entering a sustained and impulsive bearish trend.
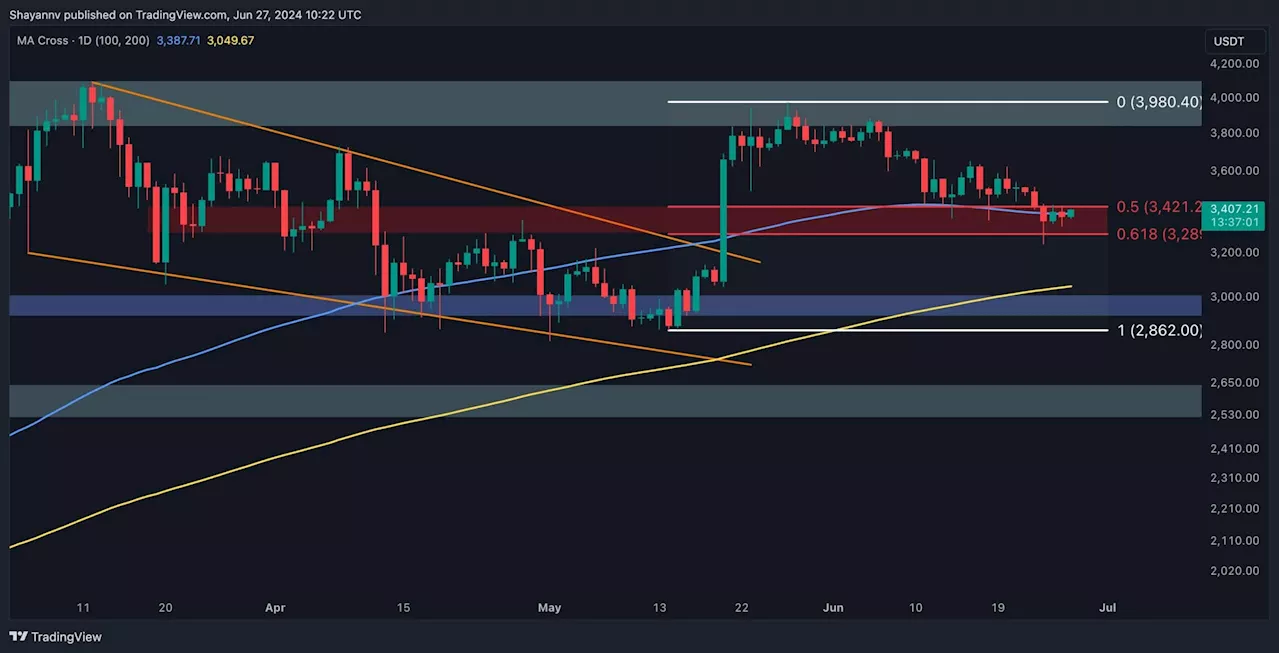
Thereafter, the price experienced an impulsive surge, which clearly hinted at a bullish revival in market sentiment. Ethereum is now at a crucial resistance region, encompassing the significant $3.4K psychological mark and the multi-month downtrend line, where selling pressure may increase.
United States Latest News, United States Headlines
Similar News:You can also read news stories similar to this one that we have collected from other news sources.
 Ethereum Price Analysis: Is ETH on the Verge of a Deeper Correction Toward $2.7K?Crypto Blog
Read more »
 Ethereum Price Analysis: ETH Holds at $3K but is Another Crash Imminent?Crypto Blog
Read more »
 Ethereum Price Analysis: Is $3K Imminent for ETH Following 5% Daily DumpCrypto Blog
Read more »
 ETH Increases Toward $3.5K, Erases Much of Earlier Losses (Ethereum Price Analysis)Crypto Blog
Read more »
 Ethereum Price Analysis: ETH Bulls Eye $3,500 as Hopes for a Bottom EscalateCrypto Blog
Read more »
 ETH Remains Relatively Stable at $3.5K but Bears Target $3,000 Next (Ethereum Price Analysis)Crypto Blog
Read more »