The USD/INR pair attracts some dip-buying near the 82.80 area, or a one-week low touched during the Asian session this Tuesday and for now, seems to h
ave snapped a three-day losing streak. Spot prices, however, remain below the 83.00 round-figure mark, the near-term bias seems tilted in favour of bullish traders.
The positive outlook is reinforced by the fact that the USD/INR pair is holding comfortably above technically significant 100-day and 200-day Simple Moving Averages . Moreover, positive oscillators on the daily chart – though have been losing some traction – suggest that the path of least resistance for spot prices is to the upside.
A sustained strength beyond the 83.00 mark will reaffirm the constructive setup and lift the pair back towards last week's swing high, around the 83.20-83.25 region. This is followed by the 83.45 region, or the record high touched in August, which if cleared decisively will be seen as a fresh trigger for bulls and pave the way for additional gains.
On the flip side, weakness below the 82.80-82.75 region might continue to attract some dip-buying and remain limited near the 82.40-82.30 confluence, comprising the 100-day and the 200-day SMAs. The latter should act as a pivotal point, which if broken will make the USD/INR pair vulnerable to accelerate the slide towards the 82.00 round figure.
Some follow-through selling below the July monthly swing low, around the 81.70-81.65 region, will suggest that spot prices have formed a near-term top and pave the way for a deeper corrective decline. The USD/INR pair might then weaken further towards the 81.35 intermediate support before eventually dropping towards testing sub-81.00 levels.
United States Latest News, United States Headlines
Similar News:You can also read news stories similar to this one that we have collected from other news sources.
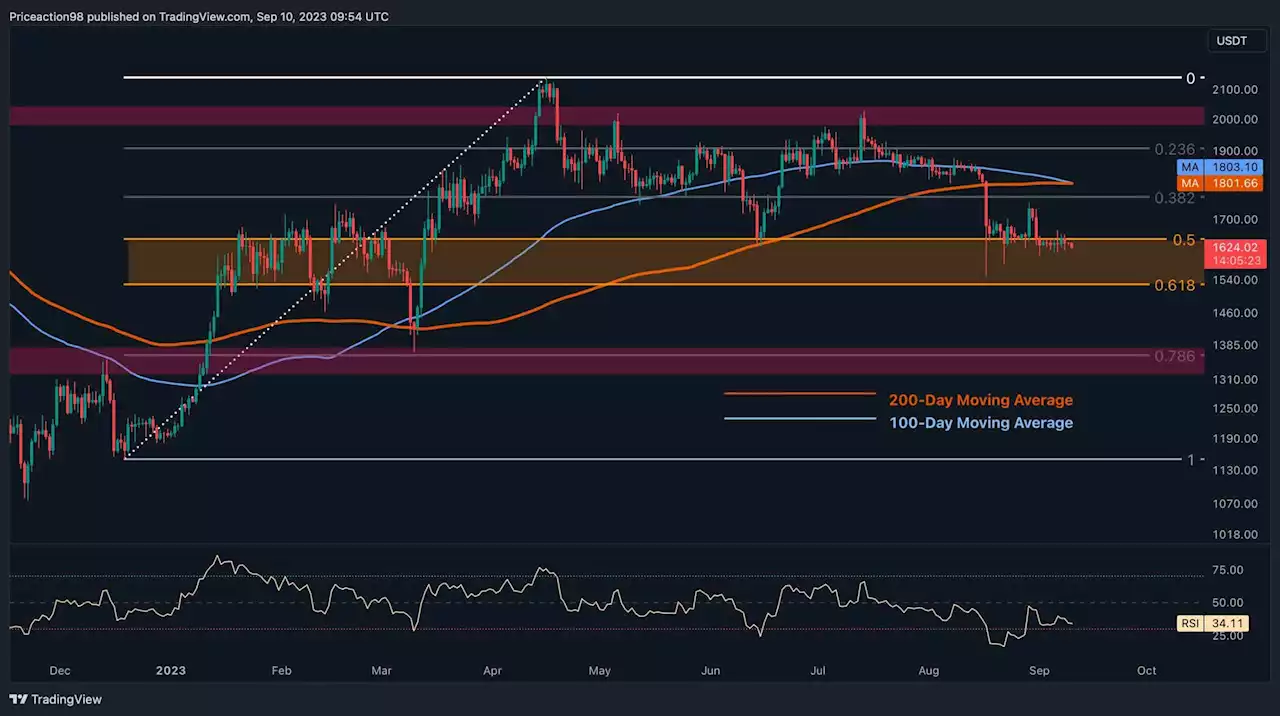
 Dangerous Pattern Emerging for ETH, Price Could Crash to $1.4K (Ethereum Price Analysis)Ethereum's price has taken a notably bearish turn, breaching several critical support levels and tilting on the verge of a concerning death cross. Despite
Read more »
USD/INR experiences downward pressure, trades below 83.00USD/INR trades lower around 82.80 during the Asian session on Monday, extending losses for the third successive day. The pair faces downward pressure
Read more »
 GBP/JPY Price Analysis: Holds steady amid hawkish BoJ; sellers eye 183.00The Pound Sterling (GBP) stops its decline vs. the Japanese Yen (JPY) as Tuesday’s Asian session begins, following Monday’s session that witnessed a 0
Read more »
 AUD/JPY Price Analysis: Subdued around current levels amid mixed signals from BoJThe Australian Dollar (AUD) posted minuscule gains on Monday versus the Japanese Yen (JPY), after the Bank of Japan (BoJ) Governor Kazuo Ueda made com
Read more »
 GBP/JPY Price Analysis: Loses traction near 183.20 within the descending triangle, Bear Cross eyedThe GBP/JPY cross trades within the descending triangle pattern since August. The cross currently trades around 183.22, losing 0.56% on the day. The r
Read more »
