
Crypto Blog
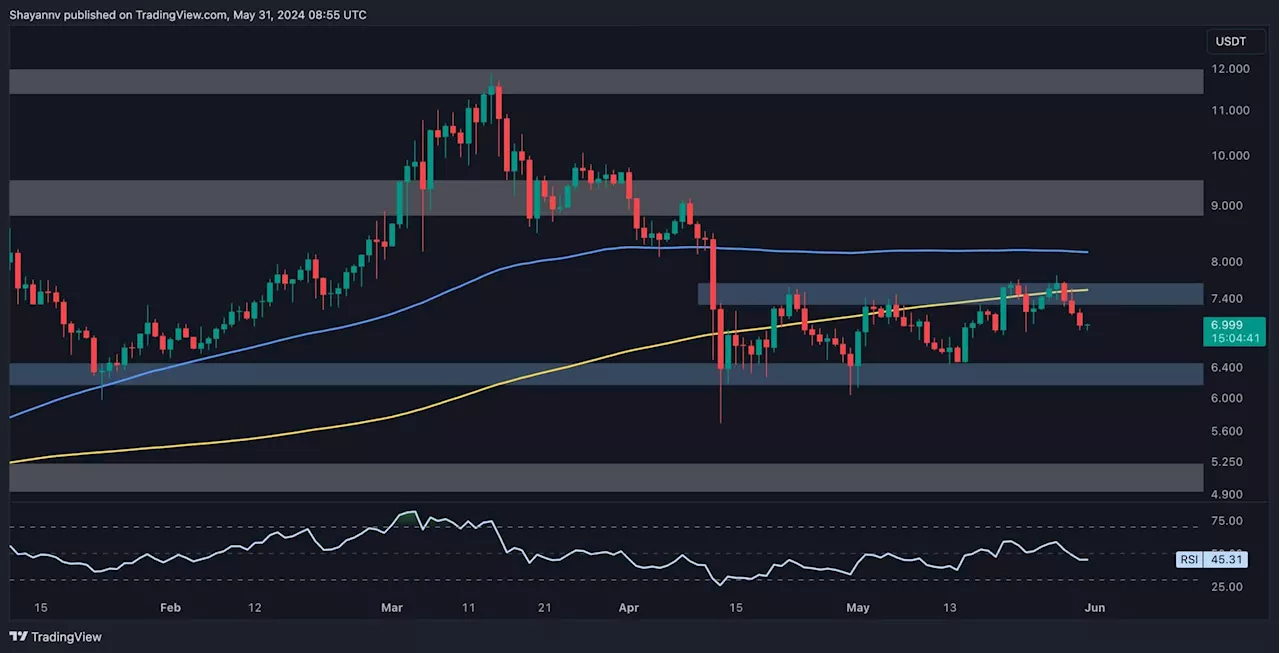
Polkadot’s price has faced significant selling pressure, leading to a notable plunge below the crucial $6 support region. The price action suggests a potential continuation of the downtrend in the short term, with no signs of recovery currently evident.
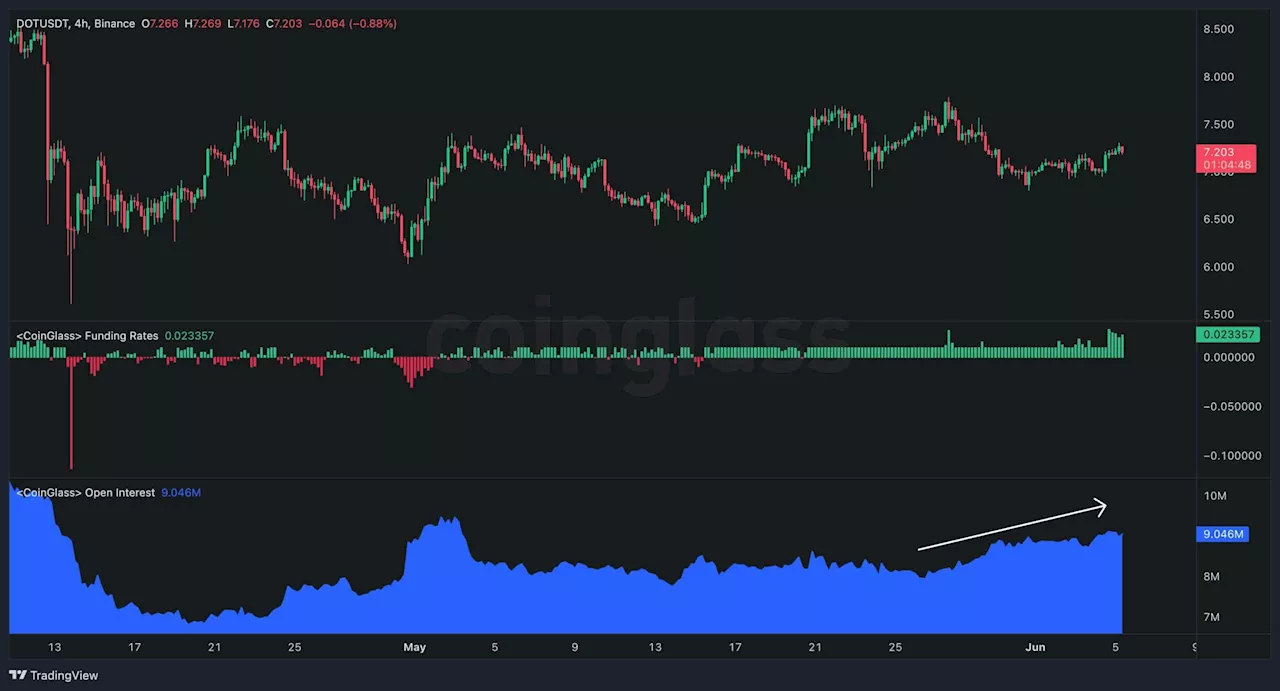
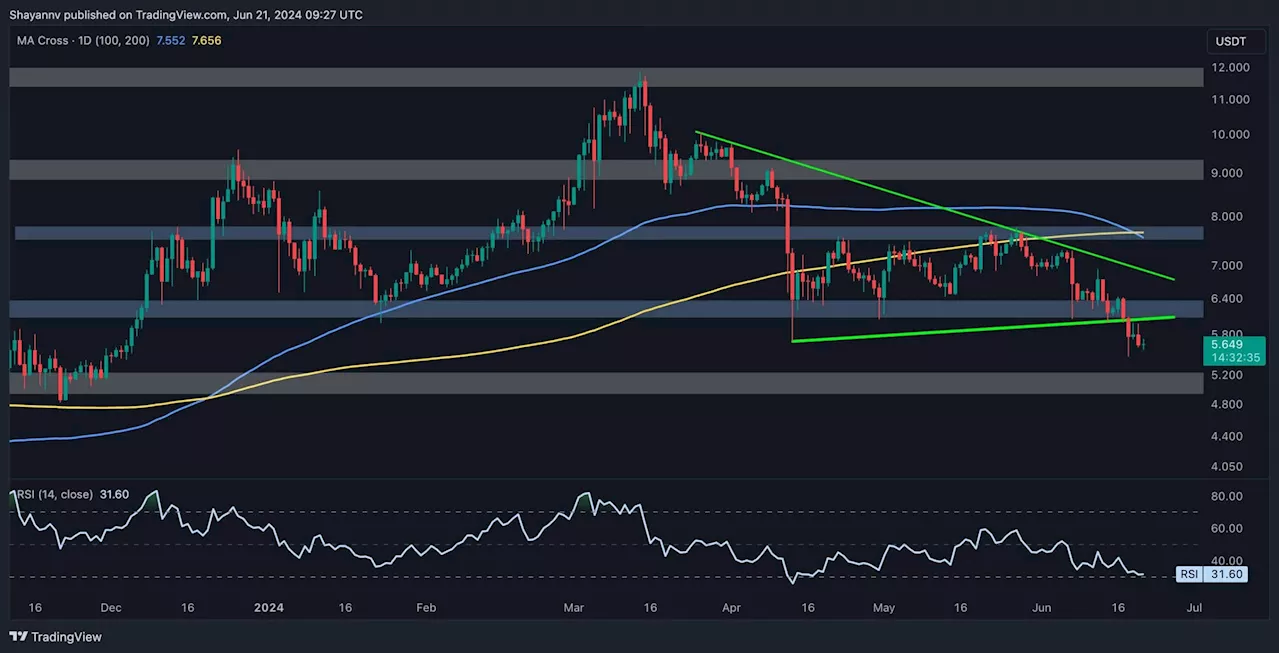
The price displays no signs of recovery on the daily timeframe, indicating the possibility of a continued downtrend. However, a slight and temporary pullback to the broken $6 threshold could occur, confirming the breakout and solidifying the bearish scenario.On the 4-hour chart, Polkadot’s price action shows a clear pattern of lower lows and lower highs, indicative of a pronounced downtrend and ongoing seller dominance.
If selling pressure intensifies and breaches the $5.5 support level, Polkadot could see further downside, targeting the substantial $5 support zone. The accompanying chart highlights the potential liquidation levels in Polkadot’s price action, which can provide valuable insights into the focus areas for smart money in the mid-term.
United States Latest News, United States Headlines
Similar News:You can also read news stories similar to this one that we have collected from other news sources.
 DOT Price Is at Critical Juncture With Potential Retracement to $6 in Sight (Polkadot Price Analysis)Crypto Blog
Read more »
 This Needs to Happen for DOT to Finally Break Above $8 (Polkadot Price Analysis)Crypto Blog
Read more »
 Polkadot Price Analysis: Is DOT in Danger of Falling Toward $5 Soon?Crypto Blog
Read more »
 USD/CAD Price Analysis: Threatening to break out of triangle price patternUSD/CAD is pushing up against the upper borderline of a large symmetrical triangle price pattern, threatening to break out to the upside.
Read more »
 Hidden Details Pointing to a Potential ETH Price Rally to $4K: Ethereum Price AnalysisCrypto Blog
Read more »
 ETH Price Fails to Challenge $4K Resistance but Promising Signs Appear: Ethereum Price AnalysisCrypto Blog
Read more »