
Natural Gas Price Analysis: Golden Fibonacci ratio defends XNG/USD bulls around $2.75 – by anilpanchal7 Gas Commodities Technical Analysis ChartPatterns Energy
DMA support. In doing so, the energy instrument remains firmer past the 61.8% Fibonacci retracement level of its March-April downturn.
As a result, the commodity price is likely to challenge the monthly high of around $2.78 before targeting May’s peak surrounding $2.82. Even if the XNG/USD remains firmer past $2.93, the $3.00 psychological magnet and March’s peak of around $3.08 could test the bulls before giving them control. In a case where the XNG/USD drops beneath $2.66, the 50% Fibonacci retracement level and the resistance-turned-support line stretched from late June, around $2.60 and $2.52 respectively, will test the commodity bears.Information on these pages contains forward-looking statements that involve risks and uncertainties. Markets and instruments profiled on this page are for informational purposes only and should not in any way come across as a recommendation to buy or sell in these assets.
United States Latest News, United States Headlines
Similar News:You can also read news stories similar to this one that we have collected from other news sources.
 Natural Gas Price Analysis: XNG/USD prods immediate support line around $2.70, death cross lures bearsNatural Gas Price Analysis: XNG/USD prods immediate support line around $2.70, death cross lures bears – by anilpanchal7 Gas Energy Commodities Technical Analysis ChartPatterns
Read more »
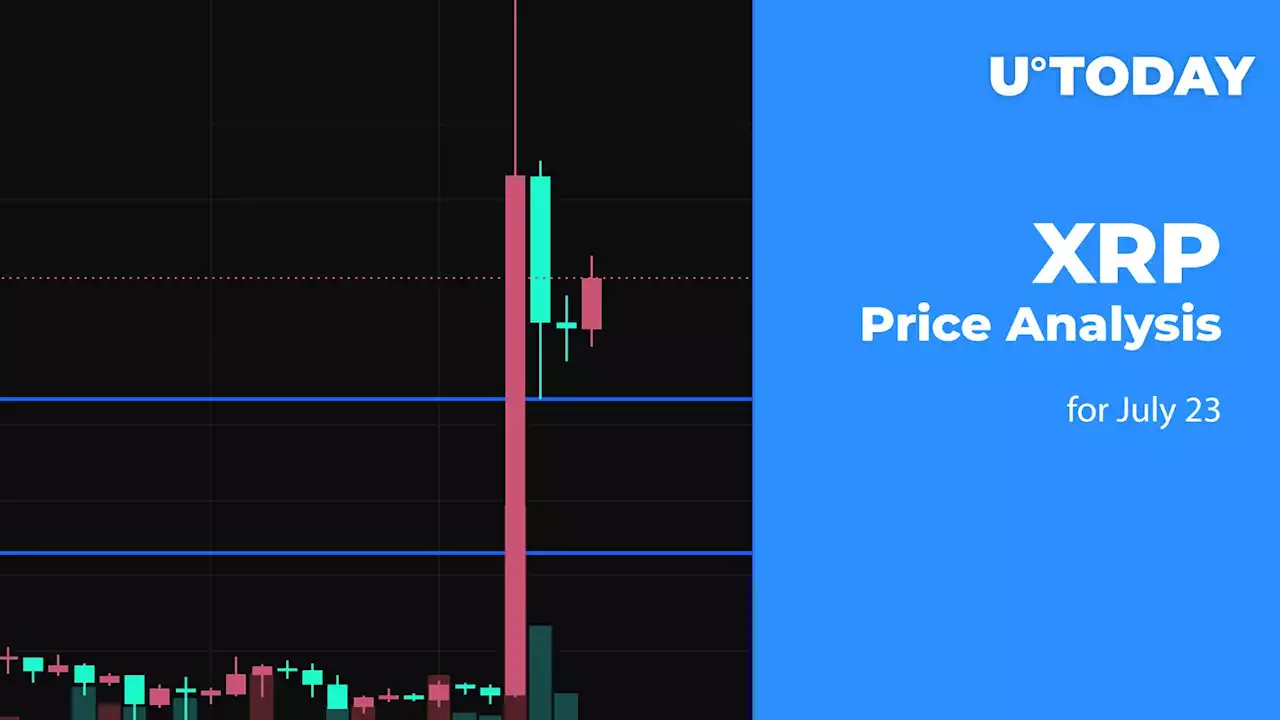 XRP Price Analysis for July 23Can the rate of XRP return to the bullish trend next week? XrpYoyo ANT159694954 nuonrg WillyWonkaXRP RippleXrpie boncryp
Read more »
 GBP/USD Price Analysis: Cable portrays pre-data anxiety within key EMA envelope around 1.2850GBP/USD Price Analysis: Cable portrays pre-data anxiety within key EMA envelope around 1.2850 – by anilpanchal7 GBPUSD PMI Technical Analysis ChartPatterns SwingTrading
Read more »
 EUR/USD Price Analysis: Edges higher past 1.1100-1090 support zone ahead of Eurozone, US PMIEUR/USD Price Analysis: Edges higher past 1.1100-1090 support zone ahead of Eurozone, US PMI – by anilpanchal7 EURUSD Technical Analysis ChartPatterns SwingTrading PMI
Read more »
 USD/CAD Price Analysis: Oscillates in a range above the 1.3220 mark ahead of FOMCThe USD/CAD pair oscillates in a narrow trading band near 1.3220 heading into the European session on Monday. In response to Friday's release of Canad
Read more »
 EUR/JPY Price Analysis: Decent resistance turns up around 158.00EUR/JPY comes under some moderated downside pressure and retreats to the low-156.00s following Friday’s YTD tops just above 158.00 the figure. In the
Read more »