MACD. No, not mcdonalds. Moving Average Convergence Divergence It’s a trend-following tool that uses moving averages to display the momentum of a stock, cryptocurrency, or other tradable asset. Burgers are not assets.
Developed by Gerald Appel in the late 1970s, the Moving Average Convergence Divergence indicator tracks pricing events that have already occurred and, thus, falls into the category of lagging indicators .
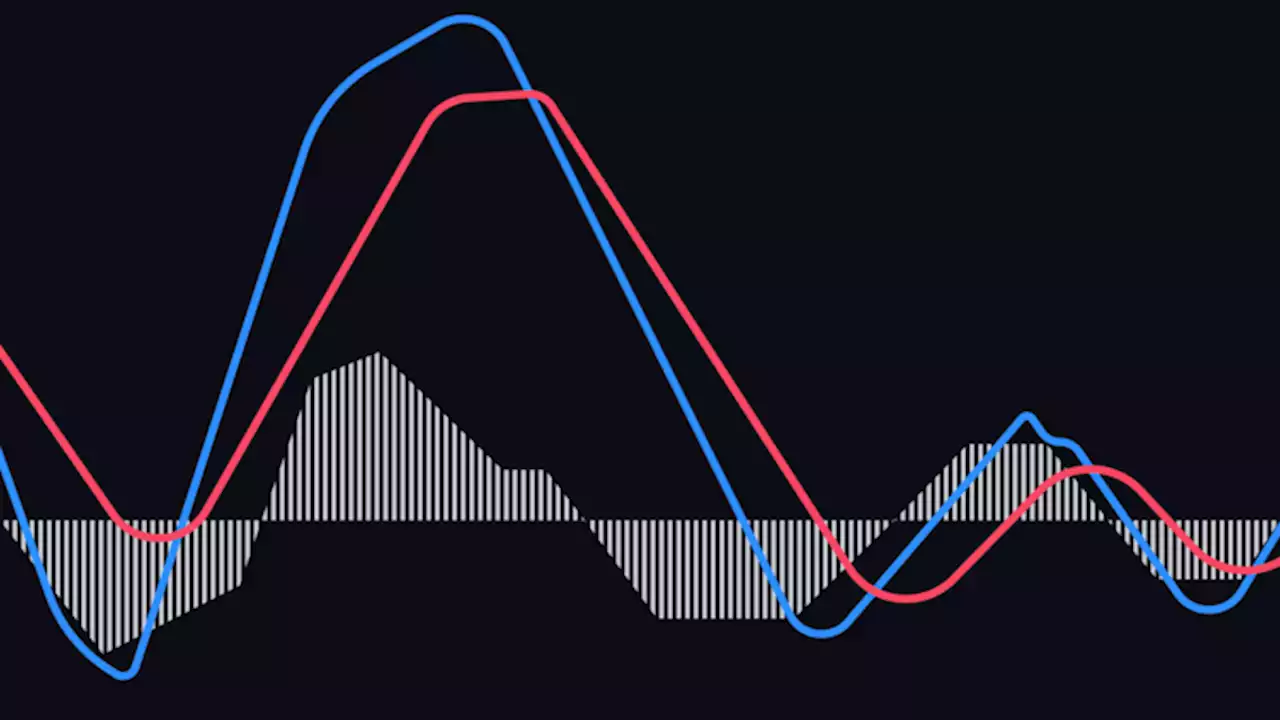
The MACD may be useful for measuring market momentum and possible price trends and is utilized by many traders to spot potential entry and exit points.moving averages . A moving average is simply a line that represents the average value of previous data during a predefined period. In the context of financial markets, moving averages are among the most popular indicators for technical analysis and they can be divided into two different types: simple moving averages and exponential moving averages . While the SMAs weight all data inputs equally, EMAs assign more importance to the most recent data values .The MACD indicator is generated by subtracting two exponential moving averages to create the main line , which is then used to calculate another EMA that represents the signal line. In addition, there is the MACD histogram, which is calculated based on the differences between those two lines. The histogram, along with the other two lines, fluctuates above and below a centerline, which is also known as the zero line.The MACD line : helps determine upward or downward momentum . It is calculated by subtracting two exponential moving averages . The signal line : an EMA of the MACD line . The combined analysis of the signal line with the MACD line may be helpful in spotting potential reversals or entry and exit points. Histogram : a graphical representation of the divergence and convergence of the MACD line and the signal line. In other words, the histogram is calculated based on the differences between the two lines.In general, the exponential moving averages are measured according to the closing prices of an asset, and the periods used to calculate the two EMAs are usually set as 12 periods and 26 periods . The period may be configured in different ways , but this article will focus on daily settings. Still, the MACD indicator may be customized to accommodate different trading strategies. Assuming the standard time ranges, the MACD line itself is calculated by subtracting the 26-day EMA from the 12-day EMA.As mentioned, the MACD line oscillates above and below the zero line, and this is what signals the centerline crossovers, telling traders when the 12-day and 26-day EMA are changing their relative position.By default, the signal line is calculated from a 9-day EMA of the main line and, as such, provides further insights into its previous movements.Although they are not always accurate, when the MACD line and signal line cross, these events are usually deemed as trend reversal signals, especially when they happen at the extremities of the MACD chart .The histogram is nothing more than a visual record of the relative movements of the MACD line and the signal line. It is simply calculated by subtracting one from the other:However, instead of adding a third moving line, the histogram is made of a bar graph, making it visually easier to read and interpret. Note that the histogram bars have nothing to do with the trading volume of the asset.As discussed, the default settings for MACD is based on the 12, 26, and 9-period EMAs - hence MACD . However, some technical analysists and chartists change the periods as a way to create a more sensitive indicator. For example, MACD is one that is often used in traditional financial markets along with longer timeframes, such as weekly or monthly charts. It is worth noting that due to the high volatility of cryptocurrency markets, increasing the sensitivity of the MACD indicator may be risky because it will likely result in more false signals and misleading information.As the name suggests, the Moving Average Convergence Divergence indicator tracks the relationships between moving averages, and the correlation between the two lines can be described as either convergent or divergent. Convergent when the lines gravitate toward one another and divergent when they move apart. Still, the relevant signals of the MACD indicator are related to the so-called crossovers, which happen when the MACD line crosses above or below the centerline , or above or below the signal line . Keep in mind that both centerline and signal line crossovers may happen multiple times, producing many false and tricky signals - especially in regards to volatile assets, such as cryptocurrencies. Therefore, one should not rely on the MACD indicator alone.Centerline crossovers happen when the MACD line moves either on the positive or negative area. When it crosses above the centerline, the positive MACD value indicates that the 12-day EMA is greater than the 26-day. In contrast, a negative MACD is shown when the MACD line crosses below the centerline, meaning that the 26-day average is higher than the 12-day. In other terms, a positive MACD line suggests a stronger upside momentum, while a negative one may indicate a stronger drive to the downside.When the MACD line crosses above the signal line, traders often interpret it as a potential buying opportunity . On the other hand, when the MACD line crosses below the signal line, traders tend to consider it a selling opportunity . While the signal crossovers can be helpful, they are not always reliable. It is also worth considering where they take place in the chart as a way to minimize the risks. For instance, if the crossover calls for a buy but the MACD line indicator is below the centerline , market conditions may still be considered bearish. Conversely, if a signal line crossover indicates a potential selling point, but the MACD line indicator is positive , market conditions are still likely to be bullish. In such a scenario, following the sell signal may carry more risk .Along with centerline and signal line crossovers, MACD charts may also provide insights through divergences between the MACD chart and the asset’s price action. For example, if the price action of a cryptocurrency makes a higher high while the MACD creates a lower high, we would have a bearish divergence, indicating that despite the price increase, the upside momentum is not as strong as it was. Bearish divergences are usually interpreted as selling opportunities because they tend to precede price reversals. On the contrary, if the MACD line forms two rising lows that align with two falling lows on the asset price, then this is considered a bullish divergence, suggesting that despite the price decrease the buying pressure is stronger. Bullish divergences tend to precede price reversals, potentially indicating a short-term bottom ., the Moving Average Convergence Divergence oscillator is one of the most useful tools available. Not only because it is relatively easy to use, but also because it is quite effective at identifying both market trends and market momentum. As most TA indicators, however, the MACD is not always accurate and may provide numerous false and misleading signals - especially in relation to volatile assets or during weak-trending or sideways price action. Consequently, many traders use MACD with other indicators - such as the
United States Latest News, United States Headlines
Similar News:You can also read news stories similar to this one that we have collected from other news sources.
 Fast-moving storms Wednesday with winds of between 60-70 mph downed trees, power lines in New LenoxStorms Wednesday afternoon that packed winds in excess of 60 mph downed trees and power lines in New Lenox and other southwest suburbs, but apparently resulted in no injuries.
Read more »
 Binance Card Supports XRP, SHIB and AVAX | Binance SupportThis is a general announcement. Products and services mentioned here may not be available in your region. Fellow Binancians, Binance has added XRP , SHIB and AVAX to the list of supported cryp...
Read more »
 SHIB, XRP and AVAX Are Now Supported Cryptocurrencies by Binance CardICYMI: Binance added $XRP, $SHIB and $AVAX as means of payment with the Binance Card XRPnews XRPArmy ShibaInu SHIBArmy Avalanche
Read more »
 Slow-moving thunderstorms could cause flooding (19 First Alert Weather Day)Humid today with scattered thunderstorms.
Read more »
 Vin Scully celebrated in moving Dodger Stadium ceremonyThe icon is remembered with a video tribute, a new banner hanging below the broadcast booth and Manager Dave Roberts leading the crowd through a chorus of “It’s time for Dodgers baseball.”
Read more »
Peugeot Puts The Stunning 408 In A Moving Sphere Display Near Paris | CarscoopsPeugeot Puts The Stunning 408 In A Moving Sphere Display Near Paris | Carscoops carscoops
Read more »