
Crypto Blog
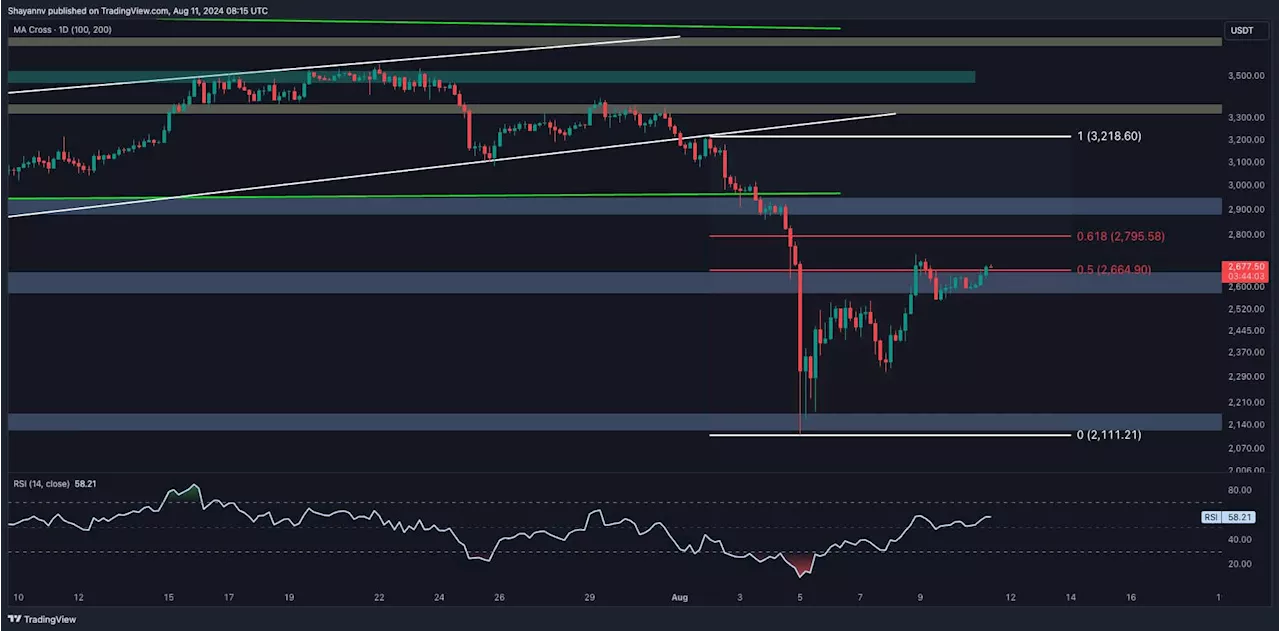
Ethereum encountered a significant rejection at the $2.8K threshold, followed by a pullback to the wedge’s broken lower boundary.
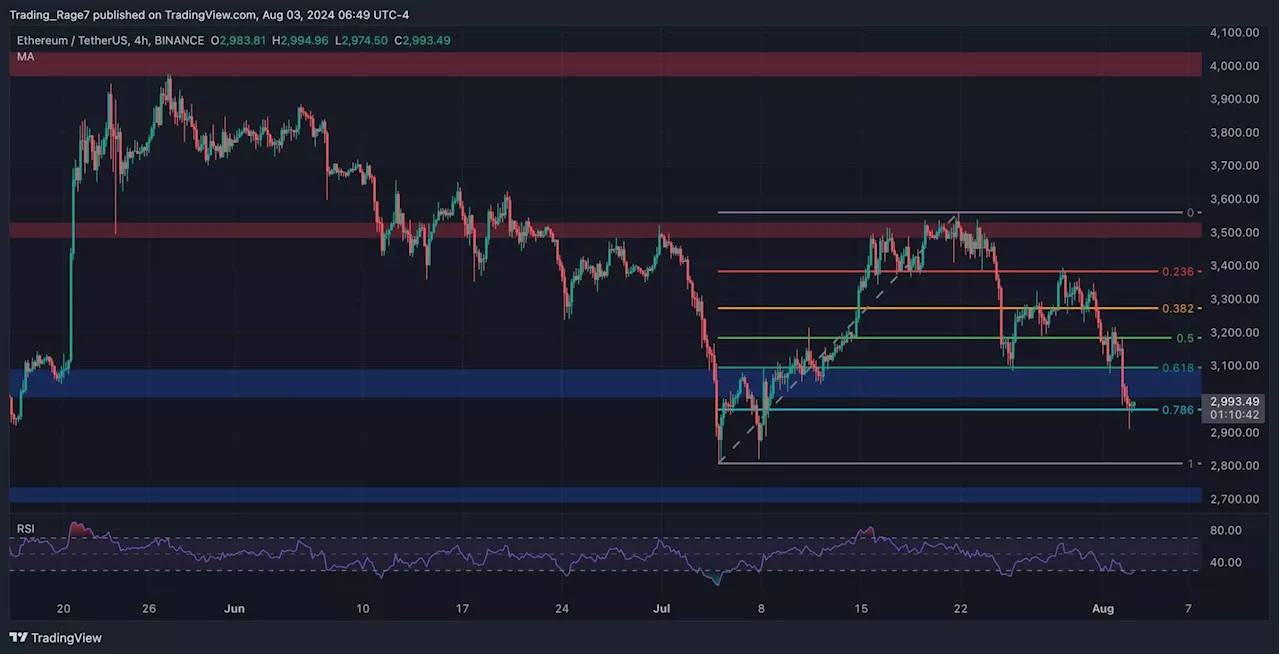
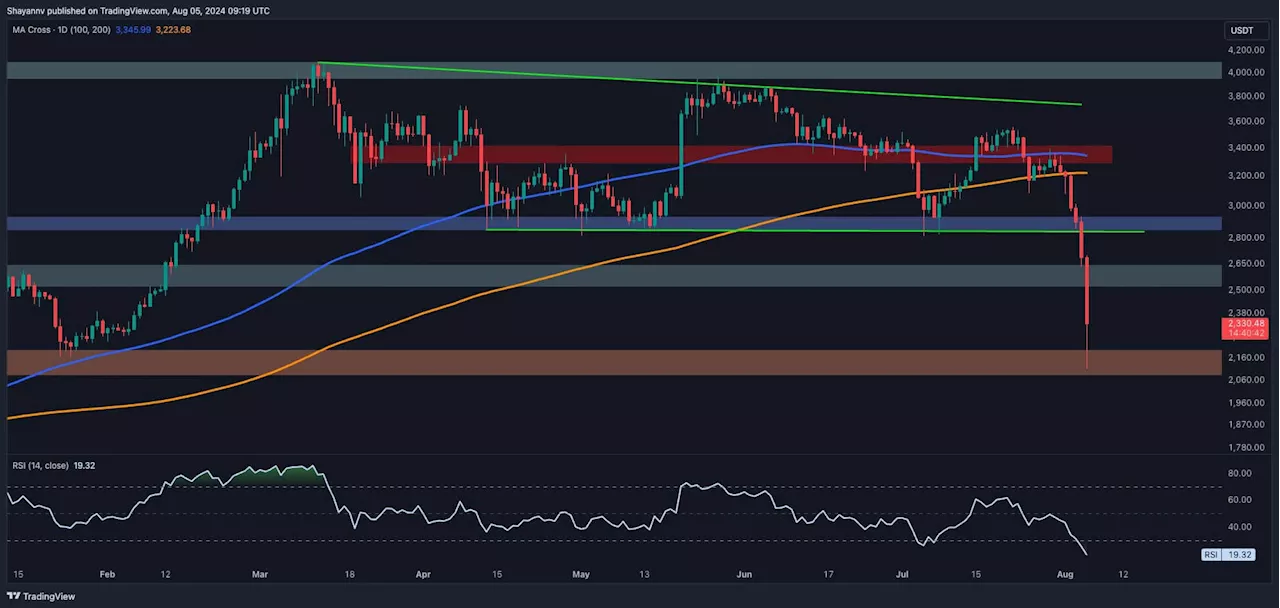
Ethereum had been struggling near the lower boundary of a multi-month wedge at $2.8K for several weeks before encountering significant selling pressure, leading to a notable rejection. Moreover, the 100-day moving average recently crossed below the 200-day moving average at $3.2K, forming a “death cross.” This bearish signal reinforces the expectation of continued downward movement toward the crucial $2.1K support zone in the short term.On the 4-hour chart, Ethereum could not break through the key resistance region defined by the 0.5 and 0.618 Fibonacci levels, leading to heightened selling pressure.
This chart showcases the Ethereum Funding Rates metric, which gauges whether buyers or sellers are more aggressive in placing orders. Positive values reflect a bullish sentiment, while negative ones indicate a bearish outlook.
United States Latest News, United States Headlines
Similar News:You can also read news stories similar to this one that we have collected from other news sources.
 Ethereum Price Analysis: ETH Plunges Below $3K But What’s the Lowest it Can Go?Crypto Blog
Read more »
 Ethereum Price Analysis: Is ETH on the Verge of Falling Below $2K?Crypto Blog
Read more »
 Ethereum Price Analysis: ETH Drops to $3.3K but is More Pain Imminent?Crypto Blog
Read more »
 Ethereum Price Analysis: Is Another Correction Imminent for ETH or is $3K in Sight?Crypto Blog
Read more »
 Ethereum Price Analysis: Is the Worst Over for ETH Following the 37% Crash?Crypto Blog
Read more »
 Ethereum Price Analysis: ETH Facing Key Resistance at $2.8K, Bears Look to ResurfaceCrypto Blog
Read more »