Crypto Blog
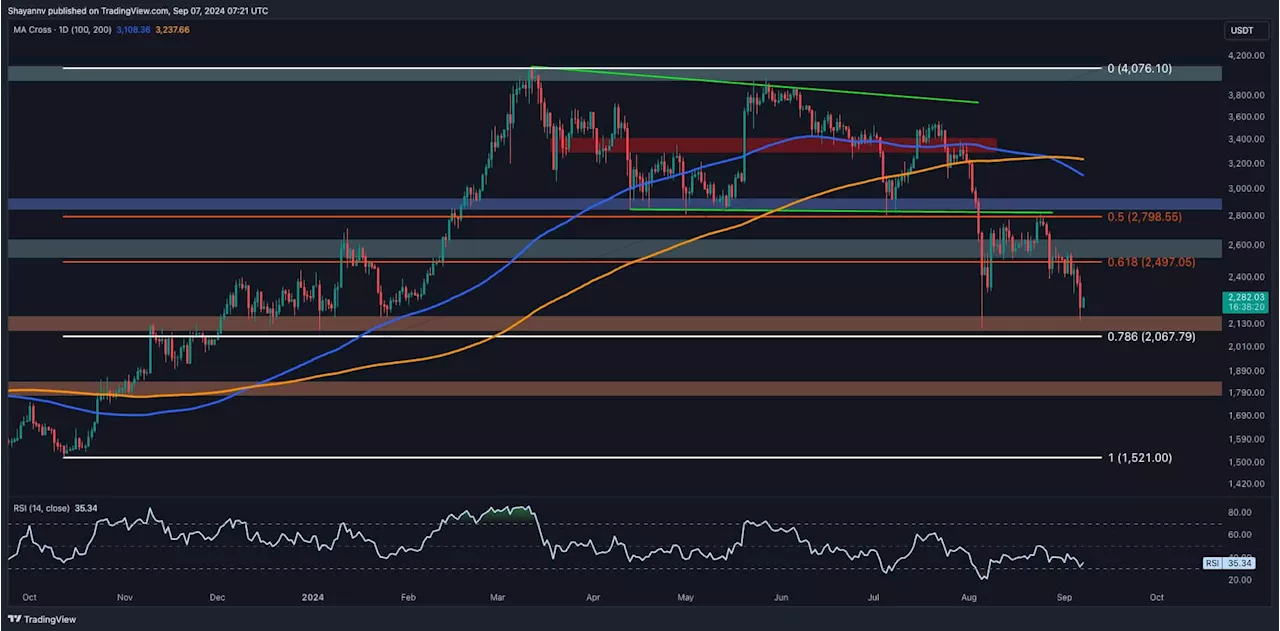
Ethereum has been notably bearish, marked by a sharp decline following a pullback to the lower boundary of a broken wedge, coupled with the formation of a death cross.
Following a rejection at the lower boundary of the multi-month wedge and the 0.5-0.618 Fibonacci levels, Ethereum has continued its decline, confirming the strength of sellers in the market. If demand resurfaces at the $2.1K mark, Ethereum may experience a temporary consolidation phase, pausing the downward pressure. However, if this crucial support is breached, it could trigger a long-liquidation event, potentially driving the price down toward the $1.8K region.
The chart showcases the 14-day moving average of Ethereum Active Addresses, which represents the total number of distinct active addresses, including both senders and receivers of ETH transactions. Since late March 2024, this metric has rapidly declined, highlighting a drop in user activity and transaction volumes.
United States Latest News, United States Headlines
Similar News:You can also read news stories similar to this one that we have collected from other news sources.
 Critical Ethereum Price Zone Identified Amid Death Cross: DetailsEthereum reveals crucial support amid death cross formation
Read more »
 'Super Diamond Hand' ETH Whale Sells Ethereum Stash'Diamond Hand' Ethereum whale sells substantial ETH amount as Ethereum price lulls
Read more »
 ETH Price Analysis: Is Ethereum on the Verge of Another Crash Below $2.5K?Crypto Blog
Read more »
 Ethereum Price Analysis: ETH Lags Behind as Pullback to $2.1K Becomes PossibleCrypto Blog
Read more »
 Ethereum Price Analysis: ETH Bulls Eye $2.8K but Worrying Signs AppearCrypto Blog
Read more »
 Ethereum Price Analysis: Is Another Correction Imminent for ETH or is $3K in Sight?Crypto Blog
Read more »