
Bullish: Bitcoin Charts Similar Market Structure As of June 2021’s Bottom Full analysis by CryptoVizArt :
The market structure is similar to 2021’s Jun – July bottom, and without a catalyst, a likely case for bitcoin is to be traded sideways in the mid-term.On the daily timeframe, by examining historical data of the previous two market corrections, the trend was reversed after the 14-Day RSI broke above the SMA- 200 line.
Also, the beginning of the downtrend has been associated with breaking below this long-term moving average line, marked by red vertical lines. Therefore, if history repeats itself, a possible crossing in the mid-term can provide a better opportunity for traders to rejoin the market.Bitcoin on the 4-hour timeframe is struggling with the same downtrend line since touching the ATH. So far, the price has been rejected by it.
The intersection of this downtrend and the static resistance at $40K is a critical area to overcome in order to continue the uptrend. Breaking above this area could signify that the bulls are returning to the market.The Net Unrealized Loss shows the aggregated value of UTXOs in a loss, divided by market cap. An increasing trend in value means that more investors are starting to be at a loss, which might indicate a possible bottom.
Since touching $33K a week ago, this metric has fluctuated in the 0.1 – 0.17 range, resembling the same structure that the market had seen in 2021 Q2’s bottom reached in June. Based on this metric, a possible scenario is a sideways chopping over the mid-term.
United States Latest News, United States Headlines
Similar News:You can also read news stories similar to this one that we have collected from other news sources.
 Charts and history suggest stocks, most commodities may have a strong 2022, says Jim CramerCarley Garner 'thinks the momentum from the last couple years of money-printing will continue to push these asset classes higher,' CNBC's Jim Cramer said.
Read more »
Charts: China has only met 60% of its commitment in Trump's trade dealCharts: China promised Trump it would buy an additional $200 billion worth of US exports — but only met 60% of the trade deal target
Read more »
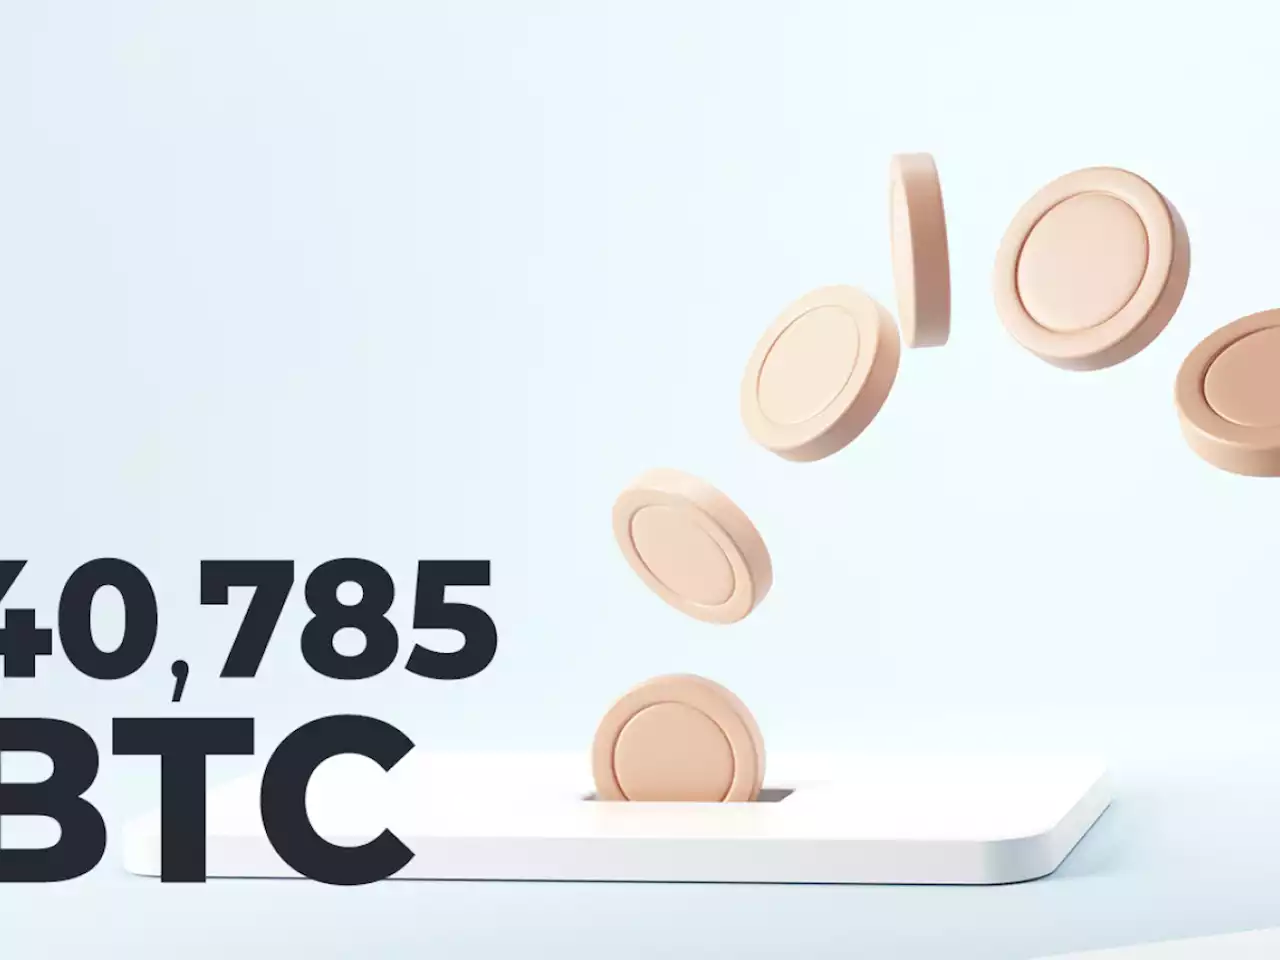 40,785 BTC Transferred as Bitcoin Reaches $39,000, A Historically Strong Sign for Price⬆ +13 40,785 BTC Transferred as Bitcoin Reaches $39,000, A Historically Strong Sign for Price $BTC bitcoin
Read more »
 40,785 BTC Transferred as Bitcoin Reaches $39,000, A Historically Strong Sign for PriceBitcoin hits $39,000, 'a historically good sign for price,' after transfer of 40,785 $BTC BTC crypto
Read more »
 Bitcoin price down 20% so far in 2022 after worst January since 2018A January to forget for Bitcoin. BTC is down 20% since the beginning of the year after suffering its first red January since 2018.
Read more »
 US crypto executive order looms — 5 things to watch in Bitcoin this weekBitcoin squares up to stocks and regulators as BTC price action fails to impress.
Read more »