
Crypto Blog
Bitcoin’s recovery is going well, and the market is seemingly on the verge of creating a new all-time high in the short term.
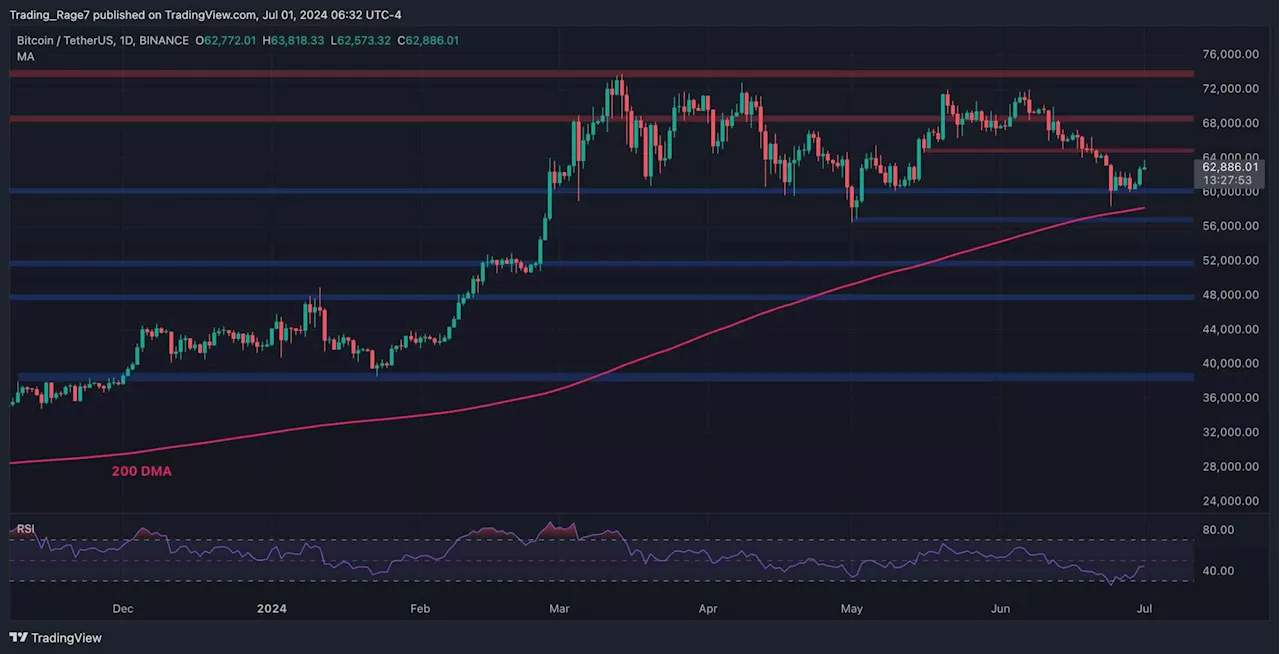
As the daily chart depicts, Bitcoin’s price has been rallying since it rose above the 200-day moving average. The market has also reclaimed the $60K and $65K levels and is moving toward the $68K resistance zone, which could be the last obstacle before creating a new all-time high. With the RSI also indicating that the price has clear bullish momentum, it could only be a matter of time.Looking at the 4-hour chart, it is evident that the price has been rising rapidly since breaking the bearish trendline to the upside.
While almost everything points to a new record high in the coming weeks, there is one worrying signal. The RSI is showing a clear bearish divergence between the recent price highs, which could indicate a correction or even a reversal in the short term.Disclaimer: Information found on CryptoPotato is those of writers quoted. It does not represent the opinions of CryptoPotato on whether to buy, sell, or hold any investments.
United States Latest News, United States Headlines
Similar News:You can also read news stories similar to this one that we have collected from other news sources.
Bitcoin miner sell pressure 'weakening' as BTC withdrawals drop 85%Bitcoin miners cool BTC withdrawals in June in what analysis says is 'weakening' Bitcoin sell pressure.
Read more »
 Bitcoin Price Analysis: Is BTC About to Crash Below $60K Again?Crypto Blog
Read more »
 Bitcoin Price Analysis: Is the BTC Correction Over Following Latest Move to $63K?Crypto Blog
Read more »
 Bitcoin Price Analysis: Is the BTC Bull Run Over as Bulls Lose 200-Day Moving Average?Crypto Blog
Read more »
 Bitcoin Price Analysis: BTC Recovers $57K but is the Bottom In Already?Crypto Blog
Read more »
 Bitcoin Price Analysis: BTC Needs to Reclaim This Level to Resume Bull RunCrypto Blog
Read more »