
Crypto Blog
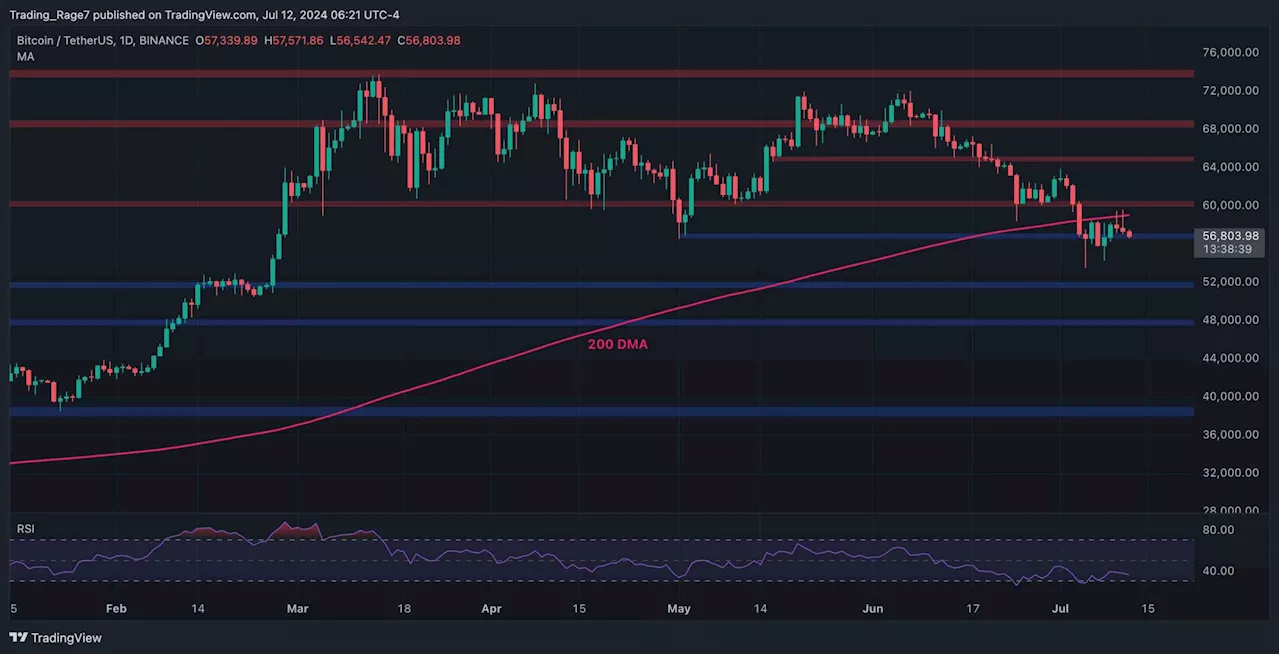
Bitcoin has recently seen an uptick in demand near a crucial support level, leading to a slight rebound above the 200-day moving average at $59.2K.
Additionally, a bullish divergence between the price and the RSI indicator further suggests the possibility of a bullish reversal in the short term. If Bitcoin stabilizes above the 200-day MA, this could confirm a bullish revival in the mid-term, with the next target being the 100-day moving average at $64.6K.On the 4-hour chart, Bitcoin faced rejection near the multi-month upper boundary at $71K, entering a sustained bearish trend marked by lower lows and highs.
If the cryptocurrency reclaims this resistance area, the bullish trend could continue toward the $65K mark. Conversely, a rejection at this level would likely result in the continuation of the bearish trend, targeting the critical $56K support.On-chain data highlighting miners’ profitability has proven to be a valuable tool for anticipating market bottoms during bear markets and the end of correction periods within bull markets.
United States Latest News, United States Headlines
Similar News:You can also read news stories similar to this one that we have collected from other news sources.
Buying the dip? Bitcoin institutional investors add 100K BTC in a weekBitcoin institutional investors go on a 100,000 BTC buying spree amid BTC price lows.
Read more »
 Bitcoin Price Analysis: Likelihood of a BTC Drop to $52K Increasing Following Recent DeclineCrypto Blog
Read more »
 Bitcoin Price Analysis: BTC Needs to Reclaim This Level to Resume Bull RunCrypto Blog
Read more »
 Bitcoin Price Analysis: BTC Not Quite Ready to Challenge $60K, Watch This Level FirstCrypto Blog
Read more »
 Bitcoin Price Analysis: Is the BTC Bull Run Over as Bulls Lose 200-Day Moving Average?Crypto Blog
Read more »
 Bitcoin Price Analysis: BTC Recovers $57K but is the Bottom In Already?Crypto Blog
Read more »