Crypto Blog
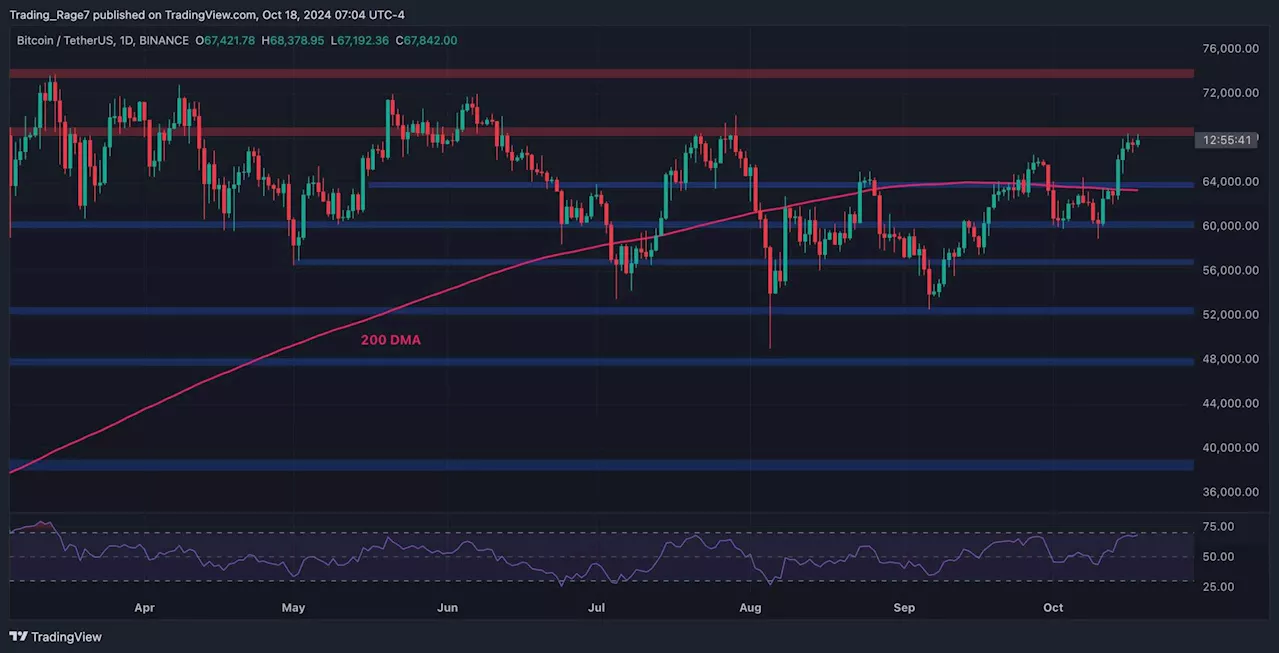
Bitcoin’s price is located in a key area at the moment and is one bullish breakout away from rallying toward a new all-time high.On the daily chart, the price has been rallying consistently over the past few days, following its rebound from $60K. With BTC also being above the 200-day moving average, which is located around the $64K level, the market can be considered bullish once again.
If the market fails to break above the $69K resistance zone soon, a correction toward the $64K level would be probable. This chart demonstrates the Bitcoin open interest metric, which measures the number of open perpetual futures contracts. It’s a proxy for futures market sentiment, showing aggregate participation and optimism.
United States Latest News, United States Headlines
Similar News:You can also read news stories similar to this one that we have collected from other news sources.
 Bitcoin Price Analysis: The Fed Cut Rates, Now What’s Next for BTC?Crypto Blog
Read more »
 Bitcoin Price Analysis: Is BTC Heading Toward $70K or $60K Next?Crypto Blog
Read more »
 BTC Price Analysis: Is Bitcoin Targeting $70K in the Short Term?Crypto Blog
Read more »
 Bitcoin Price Analysis: The Reason Behind BTC’s Crash to $60K TodayCrypto Blog
Read more »
 BTC Price Analysis: Can Bears Push Bitcoin Below $60,000 Soon?Crypto Blog
Read more »
 Bitcoin Price Analysis: BTC Falls Below $61,000, Here’s the Next TargetCrypto Blog
Read more »